
SharePoint to Power BI Architecture
Led the redesign of fragmented, Excel-based service reporting into a centralised SharePoint data ecosystem. Engineered a structured relational model and interactive dashboards, replacing manual consolidation with a scalable Source of Truth for management.
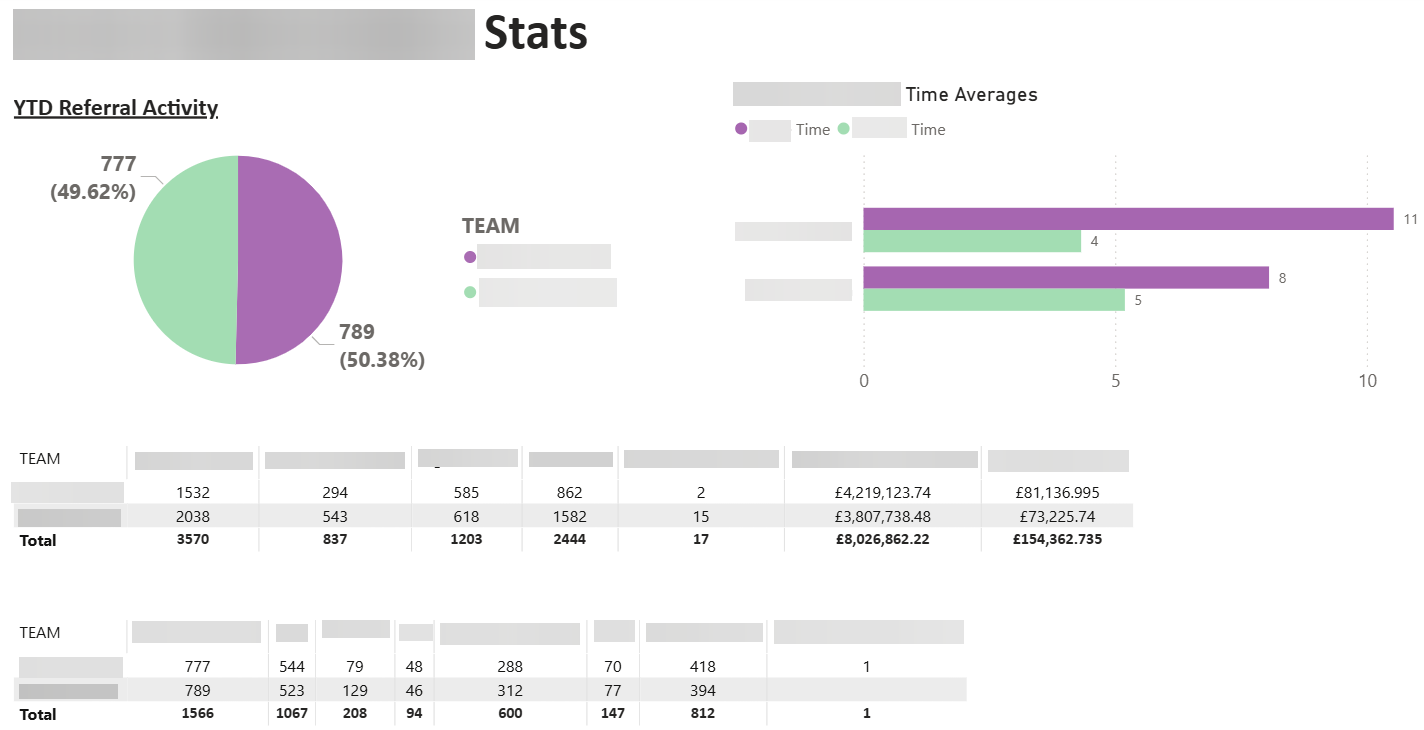
Fig 1.0: Executive Overview tracking £8M+ in financial activity.
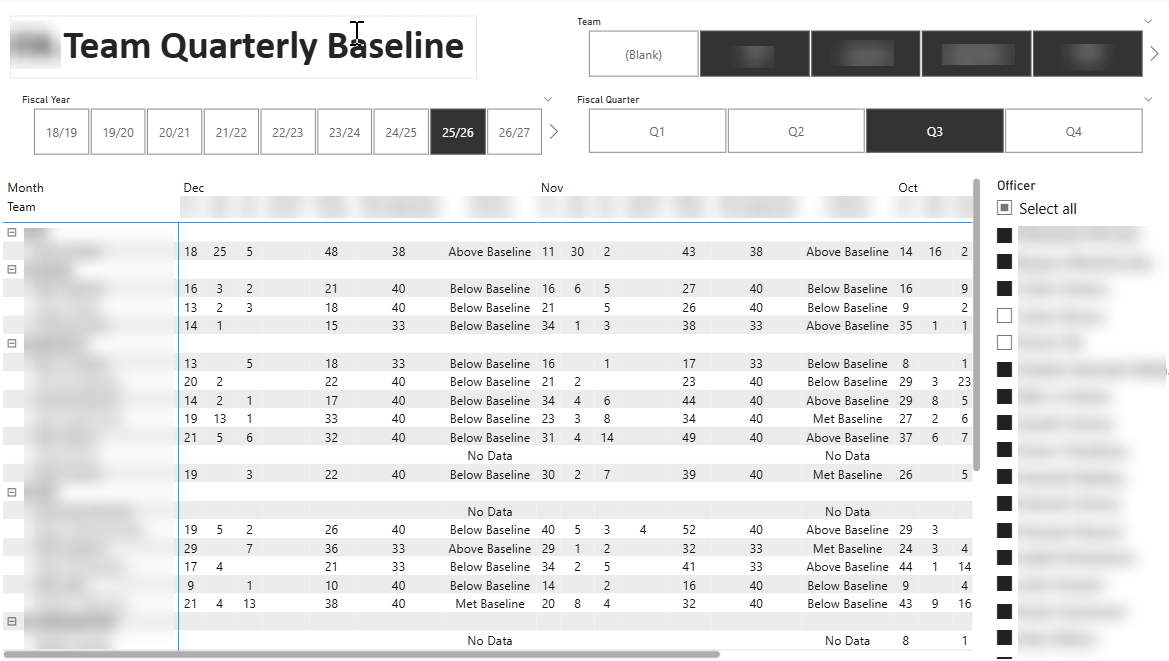
Fig 1.1: Operational drill-down for team-level SLA monitoring.
Project Process
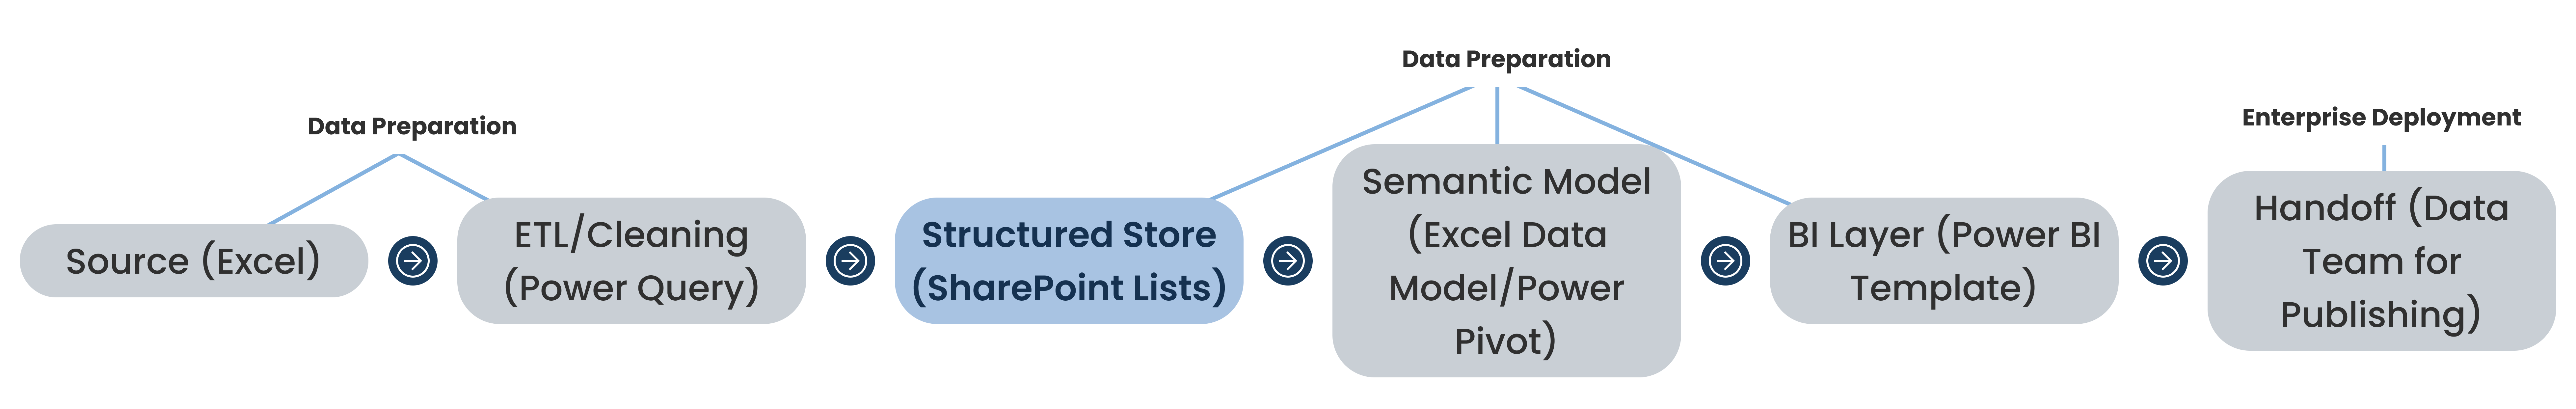
Fig 2.0: Data Architecture Overview. An end-to-end pipeline integrating Excel-based ETL with SharePoint List storage and Power BI for enterprise-grade reporting.
The Problem
Data Fragmentation: Critical service data was trapped in multiple Excel sheets with inconsistent structures across different teams.
Manual Overhead: Significant time wasted on manual data consolidation to produce management reports.
Lack of Structure: Absence of a relational data model led to inconsistent KPI definitions and restricted historical analysis.
Visibility Gap: Managers had limited, delayed visibility into operational performance.
The Solution
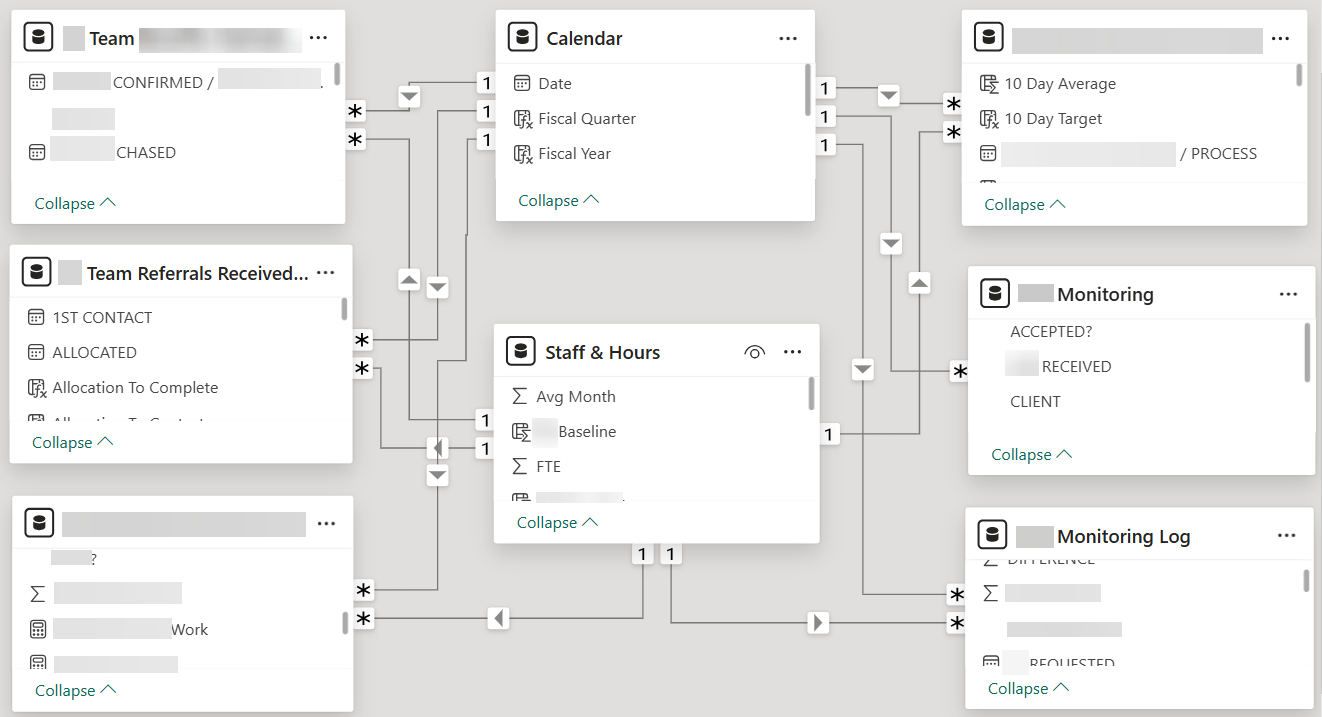
Fig 3.0: Relational Modeling (Fact/Dimension logic) connecting service data with organisational attributes.
The Impact
Standardisation
Unified KPI definitions across all teams, ensuring management reports are accurate and comparable.
Operational Insight
Provided live visibility into processing times and completion rates, enabling data-driven decision-making.
Future Proofing
Created a repeatable framework that allowed the Data & Insight team to automate refreshes and scale the solution further.